AI Data Doctor
Data Clinic, a comprehensive hospital for data, provides all-in-one services from data quality diagnosis to quality improvement.
From data quality diagnosis to improvement
Based on data treatment based on accurate quality diagnosis of data clinic, safety, efficiency, and reliability are guaranteed.
Get your AI-Ready Data ready!

I'll explain in more detail below.
Data Clinic's
Main Process
01. Data Diagnostic Engine
We use advanced AI techniques to view your data from the optimal perspective and measure its characteristics.
(2 US patents registered for core technologies including DataLens, 28 domestic and international patents applied for)

Data Imaging
Unlocking the potential of your data
Transform large amounts of data into observable and measurable data using data imaging and Data Lens technology.
Data Quality Diagnosis
Precise data analysis
Data coverage, density, homogeneity, outliers, etc. for imaging resultsGenerate detailed reports by measuring various indicators of data quality.
02. Data Improvement Engine
Based on data diagnosis, creation of precision targeting synthetic data (data bulk up),Improve data quality through data optimization and weight reduction (data diet).

Prescription for improvement
Analysis considering domain characteristics
We interpret the results of data diagnosis once again from customer and domain perspectives to suggest the most optimal data quality method.
Quality improvement
From quality improvement to reference model
We will show you how to improve data quality and create an artificial intelligence reference model through data bulking (adding synthetic data) or data dieting (volume reduction) techniques to improve performance.Want to learn more about diagnosing and improving data quality?
Step by step for Level I, II, III
Provides diagnosis.
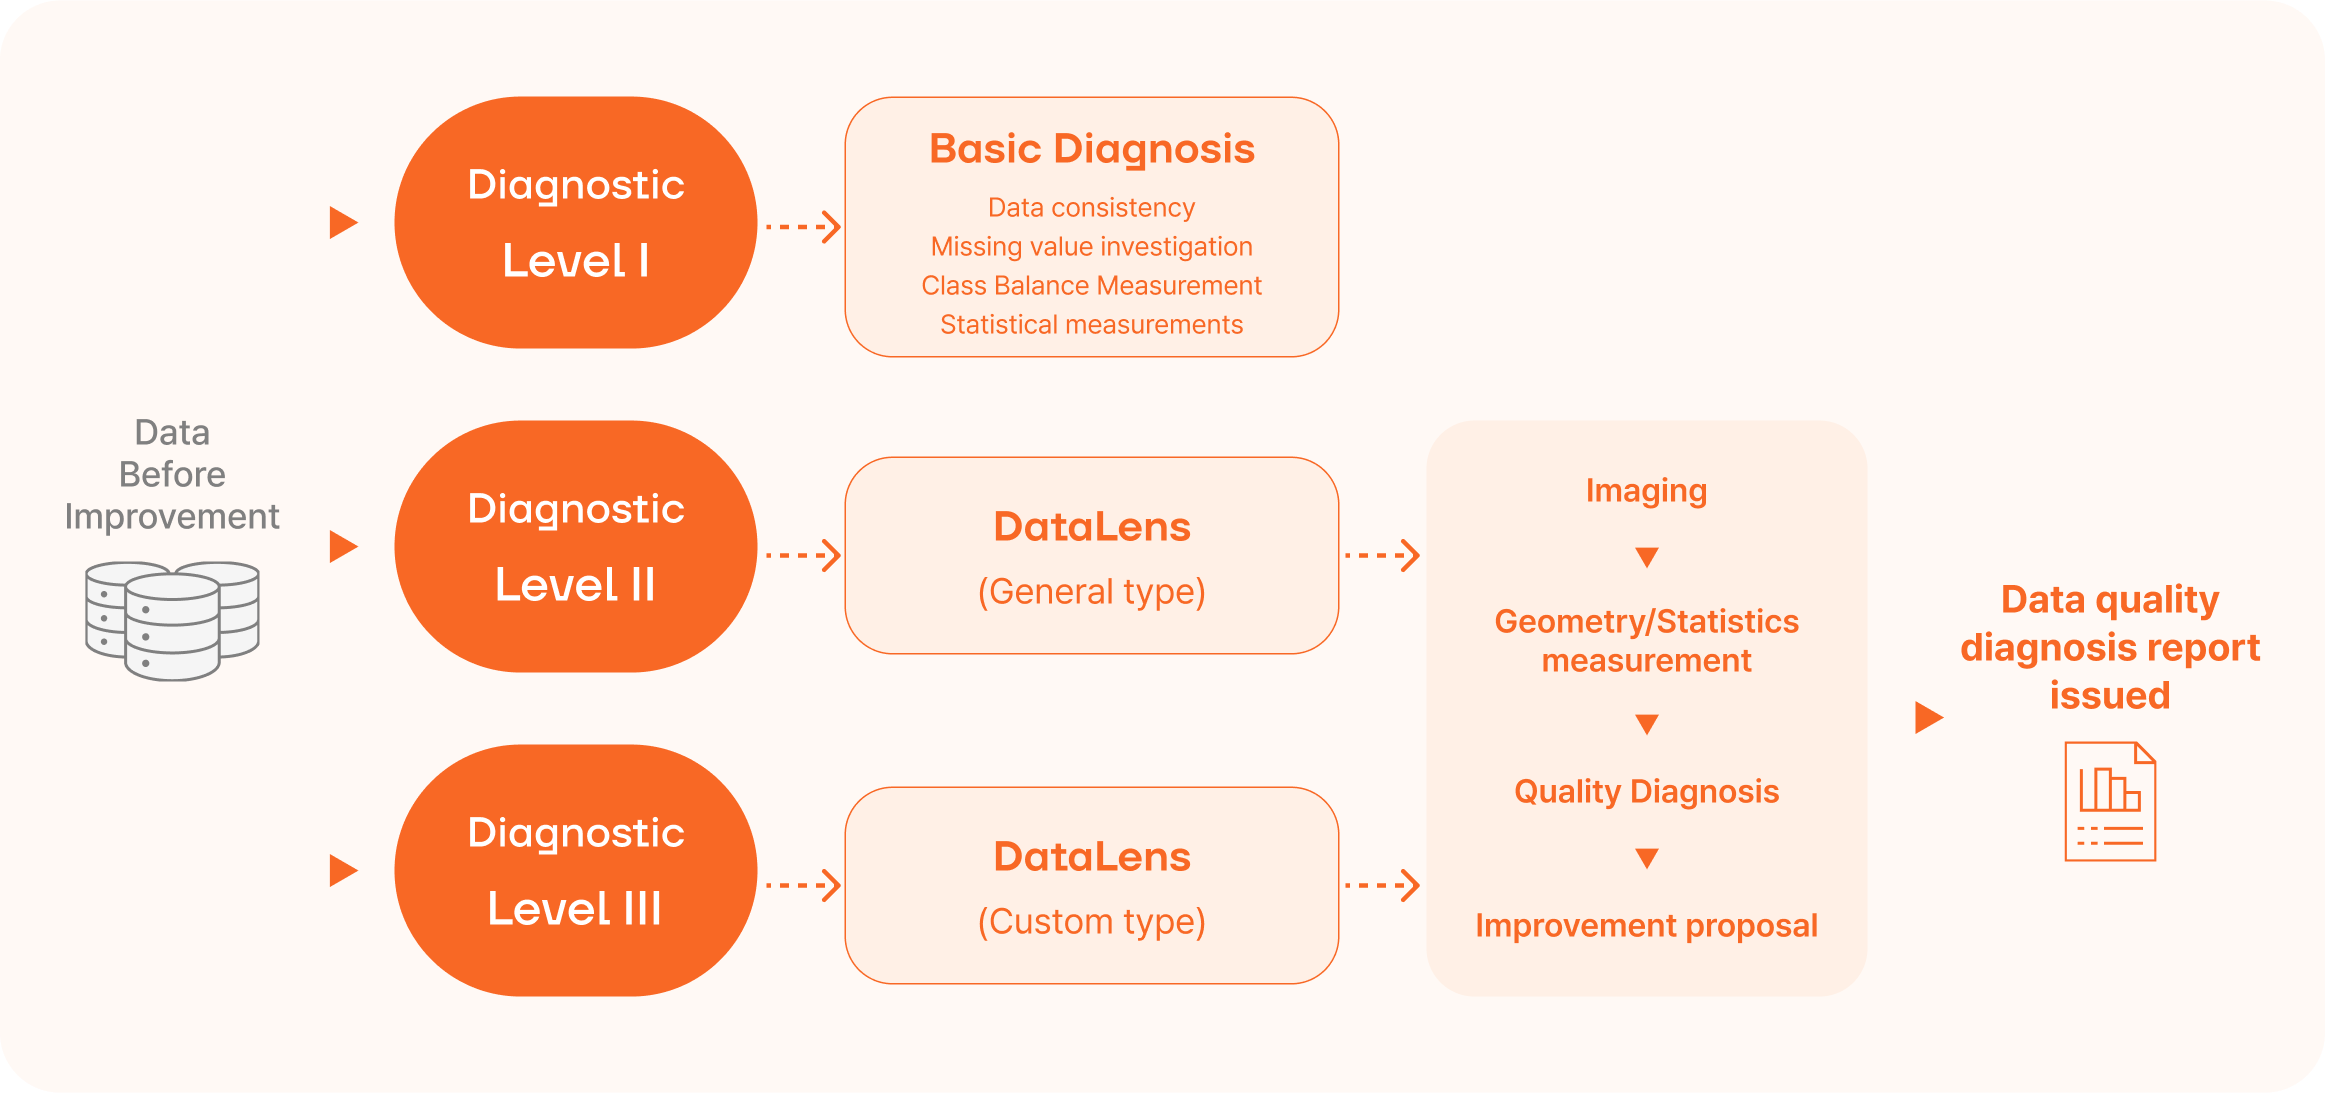
We provide systematic diagnosis, from Level I, which is a basic diagnosis based on EDA, to Level II, which fully utilizes artificial intelligence, to Level III, which is the highest-level diagnosis of the data clinic that considers data characteristics, target tasks, and even future synthetic data generation.
diagnosis Level I
: Basic Diagnosis
Level I diagnostics assess data integrity, missing values, class balance, and Statistical Measurements.
This is a basic analysis step, which prepares you for the next step.
 Measuring Data Integrity, Missing Value Measurement,
 Class Balance Measurement, Statistical Measurement
diagnosis Level II
: General lens-based diagnosis
Level II diagnostics is the step of analyzing data using DataLens, a neural network-based data lens. In this process, geometric and distributional properties are observed to identify relationships and statistical distributions between data.
Data Lens
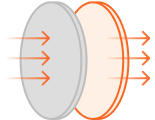
Imaging neural network
Imaging

Feature Extraction
diagnosis Level III
: Data-specific lens-based diagnostics
Level III diagnosis is the analysis step using DataLens, a custom neural network tailored to the domain of the data. This lens consists of a measurement lens and a generation lens, so it can also be used to generate synthetic data. The measurement method is the same as Level II.
Data Lens
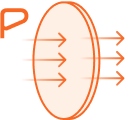
Imaging neural network
Imaging
Feature Extraction
Data Lens

Generative neural networks
What is Pebblous DataLens?
Analyze and diagnose AI data quality with Pebblous DataLens.
Pebblous DataLens uses artificial neural networks to express customers' AI learning data as feature vectors in the embedding space. Pebblous own indicators are used to measure the quality of data using various scientific indicators for the data imaging results that have been converted to enable observation and measurement.
Task-neutral quality assessment
- A process of diagnosing statistical and physical characteristics of the dataset itself, regardless of the dataset's domain or intended use.
- Perform advanced quantitative and qualitative diagnostics on the data distribution in the embedding space, along with basic quality diagnostic indicators such as consistency, integrity, and completeness.
Task-specific quality assessment
- A customized diagnostic process designed to fit the AI model and task the customer wants to configure, taking into account the domain and purpose of use of the dataset.
- Perform advanced diagnosis by simultaneously considering the data distribution of the embedding space and the characteristics of the target task, setting diagnostic goals such as class discrimination, data density, and outlier detection.
Want to see a more detailed chart?
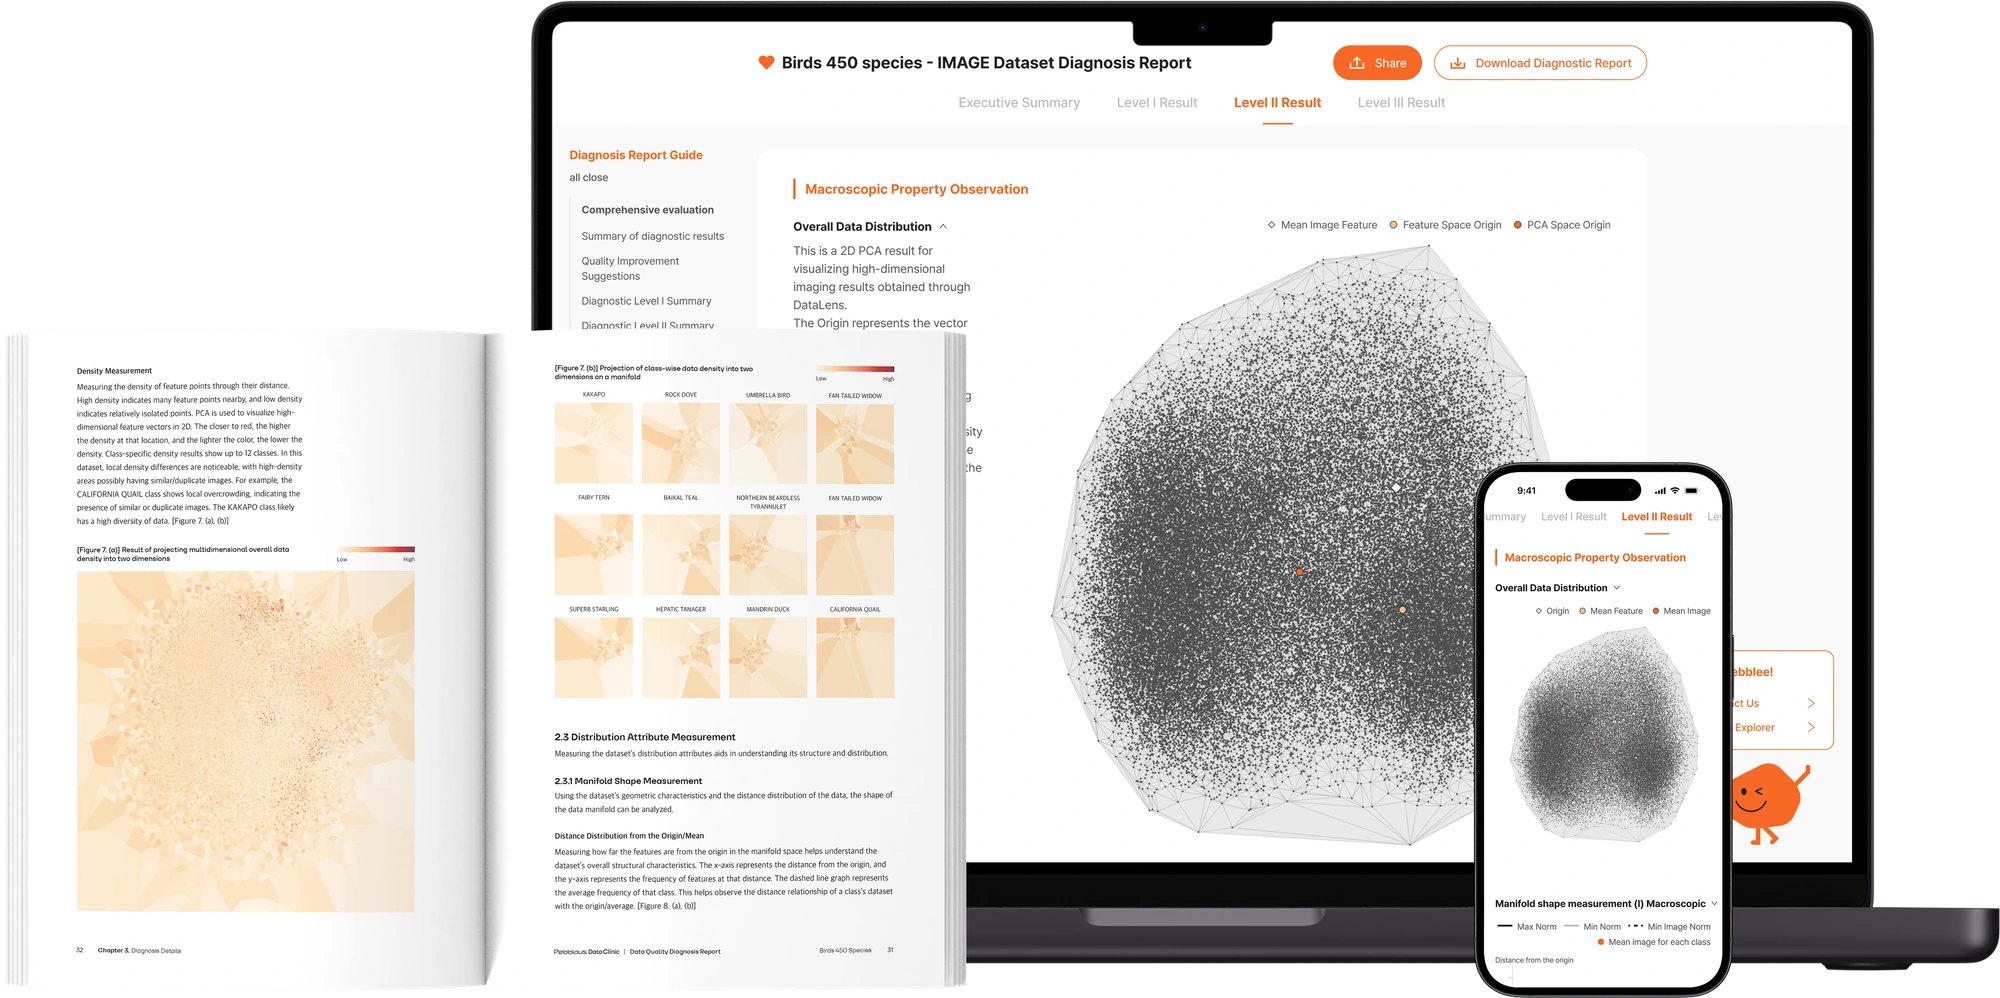
High-dimensional data embedding vectors are projected into two dimensions for visualization. This allows you to gauge the overall shape of the data, such as the presence or absence of clusters.
lowness
height

Measuring the distance between data
DataLens allows you to measure the distance between two data, which can systematically explain the similarities and differences between the two data. The distance measurement between two data can be extended to multiple data, which can be used to calculate the overall structure of the data. This method is effective in checking for the presence of outliers or duplicate data.
The 10 data closest to a specific data
The 10 data points that are furthest from a specific data point
Origin distance distribution of multidimensional feature vectors: magnitude of the vector
Measuring the internal density of data
Data density measurement quantifies the density of data points in the embedding space. It is a key technique for interpreting the structure and complex patterns of data and inferring meaningful relationships. In the data quality diagnosis report, density measurement result charts are used to identify over- or under-density areas and distinguish between data in important areas and potential outliers. This density measurement is effective in identifying data similarity, clustering, and unique patterns.
Spatial distribution of geometric properties: Projecting the density computed in the intrinsic dimension to two dimensions
lowness
height
Statistical distribution of geometric properties: Class-wise density distribution